Showing posts with label Hawaii. Show all posts

Friday, September 6, 2013

Oahu User Group Meeting


Thanks to Steve Lettau, Oahu User Group Coordinator, for arranging this meeting at Kamehameha Schools. KS was one of the early adopters of GIS in Hawaii back in the early 1990s. The user group meeting is open to the public. I checked, there still some seats available, so RSVP if you'd like to attend.

RSVP to Connie (cclinton@esri.com)

Sunday, August 4, 2013

Hawaii County GIS Resources - Address Data


I'm spending this week on Big Island working with county staff who use GIS in their work.  I've compiled some links to online resources that we'll be using during the week and since they may have broader interest, I'm sharing them here.

In a post on general resources, I provided information and links on:
  - Upcoming Events
  - ArcGIS for Desktop: Data Driven Pages
  - ArcGIS for Desktop: Editing
  - ArcGIS for Desktop: Miscellaneous
  - ArcGIS Online
  - LGIM: Local Government Information Models

In an another post I provide information and links on parcel (TMK) data.

In this post I'll cover another fundamental GIS layer in local government - the address layer.

ADDRESSES

Addresses...

http://video.esri.com/watch/1869/arcgis-for-local-government-address-maps-and-apps

http://video.esri.com/watch/2048/departmental-collaboration


Hawaii County GIS Resources - General


I'm spending this week on Big Island working with county staff who use GIS in their work.  I've compiled some links to online resources that we'll be using during the week and since they may have broader interest, I'm sharing general information here.

In other posts I provide specific information and links on:
  - Parcel (TMK) Data
  - Address Data

UPCOMING EVENTS

First, a few upcoming events including a couple of online classes:

Aug 20-22, 2013   Online Class: ArcGIS for Server: Site Configuration and Administration (10.1)
Aug 27-29, 2013   Online Class: Configuring and Managing the Multiuser Geodatabase (10.1)
Sep 18-20, 2013   Conference: HCPO Hawaii Congress of Planning Officials (Kailua-Kona, Hawaii)


ARCGIS FOR DESKTOP: DATA DRIVEN PAGES (MAP BOOKS)

There used to be an extension in ArcGIS for Desktop called "DS Mapbook". It was a great little extension that provided tools to help you create a map book. At ArcGIS 10.0 (and 10.1 and 10.2) similar tools are part of the core product on the Data Driven Pages toolbar.

I posted on the Hawaii GeoTeam 2013 blog about election data including an introduction to Data Driven Pages.  Here's the link:
http://geoteam2013.blogspot.com/2013/06/show-tell-for-module-8-election-data.html

There's a 70 minute video from Esri UC 2013 demonstrating how to use Data Driven Pages and how to customize map books using Python scripts.  Here's the link:
http://video.esri.com/watch/2598/building-map-books-in-arcgis


ARCGIS FOR DESKTOP: EDITING

There are a couple of really good videos from Esri UC 2012 that cover editing.  Each lasts more than an hour and shows lots of useful examples.
ArcGIS for Desktop Editing (An Introduction)   (Technical Workshop Video)
ArcGIS for Desktop Editing (Tips and Tricks)   (Technical Workshop Video)


ARCGIS FOR DESKTOP: MISCELLANEOUS

You can purchase a Home Use license of ArcGIS for Desktop that you can use for non-commercial, personal purposes. You can find the details here:


EXAMPLES OF EMBEDDED WEB MAPS

South Dakota Game, Fish and Parks
Kansas City Public Works
Southern California Silver Fire

Hawaii County Beach Parks - embedded web map

Click on a park for more information on that park.

Use the Hawaii County Beach Park Finder App to search for beach parks by activity or facilities available.

LGIM: LOCAL GOVERNMENT INFORMATION MODELS


LGIM - Local Government Information Model Maps and Apps 
LGIM Maps and Apps for Land Records 
LGIM Maps and Apps for Water Utilities 
LGIM Maps and Apps for Public Safety 


Tuesday, June 25, 2013

ArcGIS Skills for Hawaii

Do you want to learn ArcGIS for Desktop GIS Software?


I teach a night class for the PCATT program at Honolulu Community College that introduces students to ArcGIS for Desktop using Esri's Virtual Campus supplemented with additional Hawaii-specific "Show & Tell" information and "Challenges".

This summer (2013) I'm working on a GIS project with several students from Maui and the Big Island - Hawaii GeoTeam 2013 - and they needed to learn ArcGIS for Desktop. Since we're working remotely, I've moved a lot of my "Show & Tell" and "Challenge" content to a GeoTeam 2013 blog.

Special thanks to Alex, Jeremie, Josiah and Lotus for working on this project and helping me test the online content, and to Bill and Ria for giving me the idea to make the materials available to others.

You're welcome to use these materials to support your own self-study. You'll need to purchase the online class "Learning ArcGIS Desktop (for ArcGIS 10)". If you don't have the ArcGIS for Desktop software, you can request a copy after you register.

The online class was prepared with Desktop version 10.0 but works just fine with version 10.1. I've posted some notes where there are differences.

There are three types of blog entries: notes, show & tell and challenges.

   - Notes are used to show where version 10.0 and 10.1 are different

   - Show & Tells are used to give materials that supplement what you've learned in the online class modules.

   - Challenges are used for you to practice what you have learned using Hawaii examples.

Here are the blog entries, in order, to go with the eight modules in the online class. Modules 1 thru 4 are treated as a unit.

Modules 1 - 4 (Introduction to GIS, Features and Attributes)

   Notes on differences between 10.0 and 10.1

   Quiz

   Answers to Quiz

   Show & Tell for Modules

   Challenge for Modules

Module 5 (Editing)

   Notes on differences between 10.0 and 10.1

   Show & Tell

   Challenge

Module 6 (Tables, Analysis)

   Show & Tell on Safe Relationships

   Show & Tell on Census Data

   Challenge

Module 7 (ModelBuilder, Analysis)

   Show & Tell on Parcel Data

   Challenge

Module 8 (Layouts, Maps and Reports)

   Show & Tell on Election Data

   Challenge

Extra Credit (ArcGIS Online) - Free online tutorial, instructions in Show & Tell

   Show & Tell

Thursday, June 6, 2013

National Day of Civic Hacking Honolulu: The Mapping Guy

Looking for the links to State of Hawaii and City and County of Honolulu map services? They're about half way down through this blog. I hope you'll read the whole blog, but if you need the links quickly, here they are:


On June 1, 2013, Honolulu held an event as part of the National Civic Day of Hacking. Thanks to Burt Lum and the Code for America Honolulu Brigade for organizing and sponsoring Honolulu's event.  About half of the 50 or so people at the event were software developers, the other half were government representatives and interested citizens.

Burt introduced me as "the mapping guy" and it's true, my passion is maps and now online maps and mapping applications.

I've given talks at Hon*Celerator, Unconferenz 2013 and the PCATT IT Summit where I talk about the importance of maps and how lists of locations are good, but maps of locations are better. And dynamic maps based on map services and map applications that provide search and analysis tools are the best. Many of my past blogs have been on this same theme:


So I wanted to talk about three things, a bit different, but related, on this day of civic hacking. "No FTP / Download" is for the software developers. "Gov Apps = Citizen Apps" is for government and citizens. "Vote" is for everyone.

NO FTP / DOWNLOAD

Government is opening up more and more data and sharing it with the public. Why do I say "NO FTP / DOWNLOAD"? It was interesting how many other presentations during this national day of civic hacking involved maps. But if you stop and think about it, this makes perfect sense. Much of the data that citizens are interested in is data on places close to where they live, work, go to school and play - yes, maps!

The mapping community has been sharing open mapping data for a number of years now and one of our lessons learned is that data gets stale, it gets old, it gets outdated. At first, all we could do was go back to the ftp site regularly and check if there was an update. If there was, we'd download and process it.

But as internet connection bandwidth increased it became possible to make current mapping data available as map services. No more FTP, no more downloads, no more stale data! There are still times when I need to download mapping data, but more and more I'm able to work with the map services directly. The State of Hawaii and all four counties (Hawaii, Maui, Honolulu and Kauai) have started publishing mapping data as RESTful map services.

And it's not just mapping data. Both the City and County of Honolulu and the State of Hawaii use Socrata to host their open data portals. Data on Socrata can be downloaded, but is also available via their SODA RESTful services.

Software developers need to know how to use these RESTful services so they can decide when it's best to download data and when it's best to connect to a service. Here are a couple of examples where connecting to a map service is better than downloading.

Oahu Tsunami Refuge Centers

When a tsunami watch or warning is given, residents and visitors in tsunami evacuation areas need to leave the area. Residents often go to a family or friend's home that is outside the evacuation area. Visitors can evacuate to the upper floors of their hotels. Another option is to go to a tsunami refuge center. These centers are not shelters, they don't provide food or services, but they do provide a safe place, usually with restroom facilities, to wait until the danger has passed.

An earthquake in Canada on October 27, 2012 caused a tsunami and Hawaii received a tsunami warning. All I could find online was a list of the tsunami refuge centers, and since lists are good but maps are better, I created a mapping application that showed the evacuation zone and the refuge centers. I wrote about this on my blog and also in an article in Civil Beat that called for the government to make better use of map services to inform the public.

The City and County of Honolulu now publishes a tsunami mapping application similar to what I created during the tsunami event. Their application uses a web map with two map services also published by the City and County of Honolulu - one for the tsunami evacuation zones and one for the refuge center locations. Both these map services are open so that software application developers can use the data in their own apps.

So if you're developing an application using tsunami refuge center data, would it be better to download the data, or better to connect to the service provided and updated by the City and County of Honolulu? If you connect to the service, then as soon as the City makes a change to the data, your application will immediately see it. If you download the data then...

Hawaii Flu Vaccination Sites

The State of Hawaii Department of Health has taken what used to be a 14 page PDF list of flu vaccination locations and turned it into a mapping application that shows the locations, whether a prescription is required, whether an appointment is required, and lots of other useful information. Similar to the tsunami application, this application uses a web map with a map service of flu shot locations that is published and updated by the Hawaii Department of Health. This map service is also open so that application developers can use the data in their own apps.

The data behind the map service is updated regularly and of particular interest is a data field or column called "ShotsAvail". This column has two possible values - "Yes" or "No". If your app connects to the service, then you can use this information to correctly show which locations have either flu shots or flu mist available (Yes) and which have neither available (No). In the mapping application, only those sites where "ShotsAvail" = 'Yes' are shown. But the map service contains all the locations so you as an app developer need to pay attention to this value.

State of Hawaii and City and County of Honolulu Open Mapping Data

Hawaii, Maui and Kauai are just getting started with their open mapping portals, but the State of Hawaii and the City and County of Honolulu have published quite a few map services along with web maps and mapping applications. I showed these at the civic hacking event but the URL was too long for people to copy down, so here are the links:

   State of Hawaii Open Map Services (developers connect to these map services)

   City and County of Honolulu Open Map Services (developers connect to these map services)

These are the same links that are at the top of this blog post.

GOV APPS = CITIZEN APPS

In my Ignite talk at Unconferenz 2013, I talked about the importance of maps and open data, but also about the importance of open tools for analysis. Access to maps and data is great for citizens to have, but sometimes there are also analysis tools used by government to help understand data and to create future alternatives based on actual data. In my talk I urged that government provide these same tools to citizens.  

In my talk at civic hacking I explained in more detail a project I was involved in where this was done and how citizens used analysis tools, the same tools used by government, to provide informed public testimony that did influence government decisions.
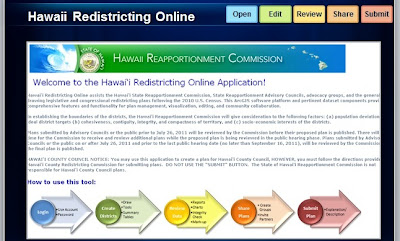
My example was redistricting. I was the mapping guy supporting the State of Hawaii Reapportionment Commission. Reapportionment and redistricting is done every ten years following the decennial census to adjust political boundaries to balance population changes. I won't get into the details on the process, you can read more here if you're interested.

The Commission was using an online mapping application that had maps, census data and analysis tools to help them re-balance the political boundaries. What is interesting is that the Commission decided to make this same online mapping application available to the public. Anyone could get a login by providing their email address and then create their own redistricting plan using the same tools as the Commission.

The public responded! By the end of the process, 586 accounts had been opened and 845 redistricting plans were created. Members of the public came to public hearings and not only submitted oral testimony, they also submitted their maps and they submitted their plans. It was a great success. And because I was the map guy working with the Commission, I can say with confidence that these publicly created maps did influence Commission decisions and that the final maps adopted did contain changes that came from public input.

And because the Commission's mapping application was using map services, those same map services, open to the public, could be used to create other applications. I created a web map and mapping application that was published to desktop and mobile devices. Smartphone users could install an app and then open up the new political maps on their iOS, Android and Windows devices.

So "Gov Apps = Citizen Apps" is my way of saying that if the government is using apps (tools) as part of their decision making, that whenever possible, those same tools should be made available to the public.

VOTE

Hawaii ranks low nationally in percent of voter registration and voter turnout on election day. There are many reasons posited for this, but my hope is that better access to government data, maps and tools will help spur understanding of and interest in government.

We were asked to come to this meeting with ideas for civic hacking projects. I don't know what form it might take, but I'd be very interested to work with a team on civic applications to try and increase Hawaii's rate of voter participation. Maybe an app for voter education, maybe an app to encourage voter registration, maybe an app to make more information on candidates and issues easily available.

Feel free to use the comment section on this blog to post your ideas on how we might do this.

And if you are a US citizen and a Hawaii resident 18 years or older, and you haven't registered to vote, do it now!

A hui ho!

Monday, May 27, 2013

Big Island User Group Links - May 28, 2013


UPCOMING EVENT LINKS

May 30, 2013   Smartphone GIS: Capturing Data with Collector for ArcGIS   (webcast)
                          (link to archive of previous webcasts)
Jun 26, 2013   HIGICC Annual Meeting   (Honolulu, Hawaii)
Jul 6-9, 2013   Survey Summit   (San Diego, California)
Jul 8-12, 2013   Esri International User Conference   (San Diego, California)
late July or August   Hawaii time zone   (instructor-led online classes)
   Class: Migrating to ArcGIS 10.1 for Server
   Class: ArcGIS for Server: Sharing GIS Content on the Web (10.1)
   Class: ArcGIS for Server: Site Configuration and Administration (10.1)
             
GIS AND OPEN DATA LINKS

State of Hawaii Office of Information Management & Technology OIMT homepage
State CIO Sonny Bhagowalia's Keynote at Hawaii Pacific GIS Conference 2012

State of Hawaii Open Data Portal
State of Hawaii Open Data for Mapping   (ArcGIS Online)
City and County of Honolulu Open Data for Mapping   (ArcGIS Online)
Maui County Open Data for Mapping   (ArcGIS Online)

Developer API Mapping Applications
Parcels and Zoning Fast Maps   (City and County of Honolulu)
EnerGIS Renewable Energy   (State of Hawaii)
Flood Hazard Mapping   (State of Hawaii)
Crime Mapping   (City and County of Honolulu)

Web Map Mapping Applications
Sewer Projects Construction Map   (City and County of Honolulu)
Tsunami Refuge Centers   (City and County of Honolulu)
Refuse and Recycling   (City and County of Honolulu)
Electioneering App   (State of Hawaii)
Exceptional Trees   (City and County of Honolulu)
Exceptional Trees with Tree Finder   (City and County of Honolulu)
Veronese Mythological Paintings Story Map   (spreadsheet from Ria Baldevia)
San Diego Story Map   (uses three web maps)
Moore Tornado Story Map   (uses two web maps)
Gallery of Story Maps

ARCGIS ONLINE RESOURCE LINKS

ArcGIS Online Tutorial with Exercises
ArcGIS Ecosystem Seminar   (one hour webinar)
ArcGIS Online for Administrators   (two module web course)
ArcGIS for Desktop Staging Tips for ArcGIS Online

A COUPLE MORE THINGS...
ArcGIS for Desktop Editing   (Technical Workshop Video)
ArcGIS Desktop for Home Use
ArcGIS Online - All Blogs 
ArcGIS Online - Bern's Blog 


LGIM - Local Government Information Model Maps and Apps 
LGIM Maps and Apps for Water Utilities 
LGIM Maps and Apps for Public Safety 
LGIM Maps and Apps for Land Records 

Friday, May 24, 2013

Maps That Change Quickly: Honolulu Lei Drop-off Sites

Photo courtesy U.S. Navy
http://www.flickr.com/photos/usnavy/7301706022/

May 24, 2013  Honolulu, Hawaii

Driving in to work today, I heard on Hawaii Public Radio that the City and County of Honolulu was seeking 50,000 donated lei to be used as part of Memorial Day services. This is something the City does every year to decorate the graves of fallen service members at the National Memorial Cemetery of the Pacific at Punchbowl and the Hawaii State Veterans Cemetery in Kaneohe.

The Mayor's Memorial Day Ceremony at Punchbowl will be held on Monday, May 27th at 8:30 am. Here's a link with more information on that event:

     Mayor's Memorial Day Ceremony 2013

Lists are good, maps are better!

At the end of the story on the radio, the announcer listed a number of locations on Oahu where donated lei could be dropped off. If you've read some of my other blog posts you've have heard me say it before - "lists are good, maps are better". A list provides basic information which is better to have than no information at all, but when it is a list of locations, a map is so much better. It is much easier for people to see a map and then find a location near them.

So I decided to turn the list into a map. But I didn't have much time. The locations were only open one day, this day, May 24th, in the morning. Some closed at noon, some at 1 pm and the rest closed at 2 pm. So I had to work fast. Here's what I did.

List of locations to map features

There were three types of drop off locations - fire stations, parks and park offices. There were a number of ways I could use to turn the list of locations into features on a map. I could work from a spreadsheet, but I knew that most of the locations were already in GIS format and available as different map services from the City and County of Honolulu so I decided to work in ArcGIS for Desktop. I created a template shapefile, brought in the different map services, selected the features I needed and copied them into my shapefile, and then edited the attributes - basically the name of the location and the hours it was open.  Here are links to the two map services I used:


Map features to web map

The next step was to add my shapefile map features to a basemap to create a web map. I used ArcGIS Online to create the web map including setting symbology (a flag at each location - this is for Memorial Day after all) and configuring the popup window to show the name and hours information. I saved my web map and gave it this description:
The description is important because in the next step I will use a template to create a mapping application. The template will present this description information on the left side of the map.

Web map to mapping application

In ArcGIS Online there are a variety of application templates available. I choose to use one called the "Basic Viewer" template. I turned off many of the tools in order to keep the application simple. I set the logo in the lower right hand corner to point to a City and County of Honolulu logo and saved my application configuration.  here's what it looked like:


You can see above how the text from the description was incorporated on the left side of the mapping application. The flags marked each of the drop-off locations.  


Clicking on a flag showed the name and hours for that location as shown above.

Time to share

All the above data editing, web map creation and map application configuration took about an hour from start to finish. During that hour, only I could see my web map and mapping application, but now that it was ready, I set the sharing property for both to "Everyone" which means anyone with internet access can see my mapping application. Time to send out a tweet...


Time to change the map!

The fire stations stopped accepting lei donations at noon. The parks stopped at 1 pm, and offices at Fasi Municpal Building and Kapolei Hale stopped at 2 pm. This information was in the popup window for each location, but I wanted to make the map more dynamic. If someone opened my mapping application after 12 noon, I wanted them to quickly be able to see only the locations which were still open - the parks and offices.  And if they opened my mapping application after 1 pm they'd only see the two offices.

So how could I quickly change my mapping application? It turns out to be pretty simple. Because my mapping application uses my web map, all I had to do was change and save my web map and the mapping application would update automatically. This loose coupling of web maps and mapping applications had worked well for me before with my electioneering app in the General Election of  2012 and it worked well again.

At noon I went in to my web map and changed the symbology for the fire stations from a flag to a light orange dot. At 1 pm I did the same for the parks, and at 2 pm I did the same for the two offices.  It worked great, it was very easy to do, and it made the maps easier to read.  

At 2 pm, when all the locations had closed, I called the City and County of Honolulu Department of Parks and Recreation to confirm that all the locations had closed.  They informed me that one site was still open, that donated lei could be dropped off through the weekend at the National Memorial Cemetery of the Pacific at Punchbowl.  Thus, for the final change to my map, I changed the basemap from streets to imagery and only showed one location, Punchbowl. I also changed the web map description to reflect the new information - which was automatically used by the template.  Here's the final mapping application:


I suspect there are many times when this ability to quickly change the features on a map will prove useful.  I'm on the lookout for more opportunities.  If you have an idea, let me know!

Wednesday, May 15, 2013

There's A Map For That: Online Mapping Resources for Hawaii

PCATT IT Summit
Presentation Notes
May 16, 2013
1:15 to 2:00 pm
Room 514

I love maps! And I love teaching teachers about maps and mapping software. So the PCATT IT Summit is a great chance for me to reach Hawaii high school Career and Technical Education (CTE) teachers and show them the great online mapping resources available here in Hawaii including data from the State of Hawaii and from our four Hawaii counties - Honolulu, Maui, Hawaii and Kauai.


Instead of handing out a piece of paper, I decided to blog my notes and relevant links so they're easy to find and share. So here we go...

These will only be some brief notes along with links to online resources. If you're interested, my full presentation is posted on slideshare. It's also embedded here:


GIS = ( ( Maps + Data ) * Analysis ) ^ ( Web + Mobile )

This handy formula summarizes the power of GIS, or geographic information systems. We start by looking at maps, but we more than just a map. We see things (features) on the map. And behind every feature on the map there is data describing that feature. On a paper map we can't see all that data, but when we bring that map on to a computer (using GIS), we can start asking questions and seeing patterns. We can start doing analysis. Analysis is the "force multiplier" of GIS. And in the last few years, all that power of GIS has been multiplied exponentially via the web and, even more recently, via mobile devices.

There was an article in the December 2011 issue of Honolulu Business Magazine that describes this in more detail and gives examples of how business and government use GIS. Here's the link:


There are many mapping applications now online, here are links to a few local ones you may find interesting:

Map Services to Web Maps

Behind the scenes, the mapping applications above are all using map services to create the maps and reports you see online. You can use these same map services to create your own online maps called web maps.  Here are some links to map services, web maps and web map applications:


Software, Training and more...

Fortunately for Hawaii teachers, the Hawaii Department of Education has a site license for the GIS software used for both desktop (ArcGIS for Desktop) and online (ArcGIS Online) mapping software that teachers can use for free!  The licenses are administered for DOE by the MEDB Women in Technology (WIT) Program.  Here are some useful links:


Tuesday, May 14, 2013

Esri Maui User Group Meeting Notes - May 13, 2013

banner
Yesterday I was in Wailuku for the Esri Maui User Group meeting.  Bill Medeiros, the user group coordinator, had asked me to go over tables, table relates and editing in ArcGIS for Desktop 10.1, and go over some of the new things in ArcGIS for Online.  My presentation on tables and table relates generated a lot discussion about parcel information and data maintained by the County of Maui Real Property Division, so much discussion in fact, that we ran out of time to cover all the topics.  So, I thought I'd use my blog to post notes on what we covered and what we didn't have time to cover.

TABLES AND TABLE RELATES

Maps are great, but what really makes our GIS (Geographic Information System) maps powerful is the data behind the map.  Every feature on the map has data (attributes) that describe that feature.  This data is stored in a geographic table with columns for the location/attributes and with a row for every feature.  The power of the GIS is expanded even more when we relate a geographic table to other non-geographic tables.  For example, a geographic table of tax map properties (parcels) might be related to a non-geographic table that lists the owner or owners of each parcel.

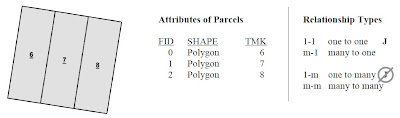
relate types
There are four main ways that tables can be related.  I won't get into the details here in my blog, but it is important that GIS users apply the correct type of relate between tables (safe relationships).  Click here for a link to a handout with some illustrations.

EDITING USING TEMPLATES

editing
Editing templates provide a very efficient way to add new features and data to your maps.  You can use templates based on symbology from your table of contents and set default data values for different types of features.  Our earlier discussion of parcel data at the meeting had taken so long that I didn't have much time to spend showing editing, but I did give a link to a great session from the 2012 Esri International User Conference where Jack Horton and Colin Childs give a very thorough demonstration of using editing templates.  Click here for a link to the 77 minute video.

LOCAL GOVERNMENT MAPS AND APPS

For my editing example, I used a public safety data schema from the Local Government Information Model, or LGIM.  Esri has developed this model based on its experience working with many state and local government agencies.  Agencies who adopted the LGIM can then use free maps and map applications (apps) to quickly create new, powerful mapping applications to server their local businesses and residents.  At the user group meeting I showed a few of these maps and apps.

Click here to see maps and apps for Land Records.
Click here to see maps and apps for Public Safety.
Click here to see maps and apps for Water Utilities.
Click here for more information on Local Government Maps and Apps.

And for those you who are developers, the code is available on GitHub.

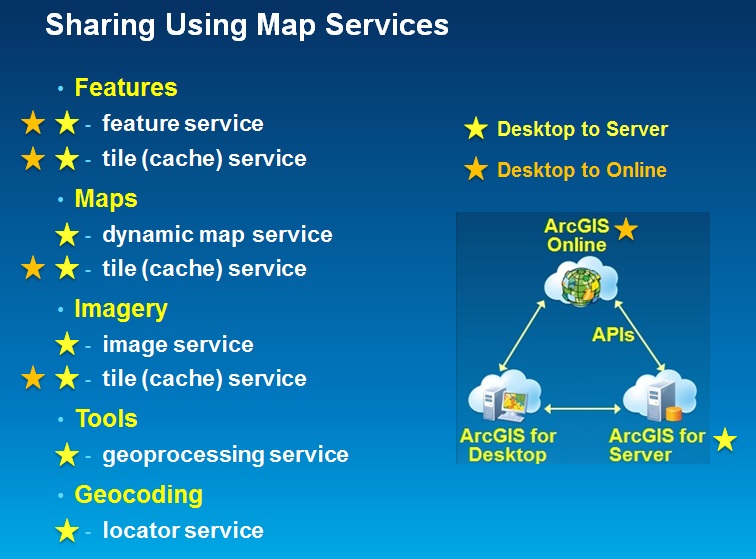
SHARING USING MAP SERVICES

When GIS professionals share data they often use packages which work well for sharing with other GIS professionals, but require special software to use.  Now we can share data using map services which can then be used in a variety of ways by both GIS professionals and those without GIS experience.  During the user group meeting I briefly talked about the different types of services that you can publish from ArcGIS for Desktop 10.1 to either ArcGIS for Server or to ArcGIS Online.

In this diagram you can see which types of services you can use to share different types of data and tools.  All eight types can be published to ArcGIS for Server.  Four of the eight can be published to ArcGIS Online.  During the meeting I published my event planning data as a feature service to ArcGIS Online.  There are other types of services you can publish, click here for a complete list.

WHAT'S NEW IN ARCGIS ONLINE

The best way to keep up with what's new in ArcGIS Online is via the blogs.  Here are a few links you'll find helpful:

What's New - The Latest
What's New in March 2013
Bern Szukalski's Blog (my favorite)
All ArcGIS Online Blogs

Next Maui User Group meeting is August 26th.  Maybe I'll see you there!

Answers to Safe Relationships handout:
1)  1-1 (one to one)
2)  F (Fee)
3)  m-1 (many to one)
4)  Join Tenure to Parcels using TMK, then Join "Tenure Type" to Parcels using Tenure/Tentype
5)  1-m (one to many)
6)  You can, but don't!  Use Relate instead.
7)  Parcel 7, $200,000
8)  Parcel 6, $300,000
9)  Summarize Buildings table by TMK and Sum BLDGVAL, then Join the summary output table to Parcels using TMK
10)  m-m (many to many)
11)  Summarize Owners table by TMK and First OWNER, for all rows in summary output table where Count=1 you know the owner, for all rows where Count>1, set the owner name to "multiple" or something to indicate more than one owner.  You might even include the count itself, eg: if Count=7, set owner name to "multiple (7)".

Thursday, May 2, 2013

Zero to App in 36 Hours: Oahu's Exceptional Trees

I've been a judge at a couple of hackathons (software development competitions) here in Honolulu. The teams that win often use several application development tools that they know well and can mix and match to come with a good solution in a short amount of time. I recently had a chance to use several of the mapping tools that I know well to create an app in less than 36 hours.  Here's the story...

Burt Lum (@Bytemarks) posted a dataset on the City and County of Honolulu's ("the City's") open data portal (http://data.honolulu.gov) that listed 166 exceptional trees on the island of Oahu. Click here for more information on Oahu's exceptional trees program.

April 30, 2013 10:51 am: Burt sent a tweet about the new dataset and noted there were no GPS coordinates, only TMK values. TMK (Tax Map Key) numbers are used as parcel identifiers in Hawaii, so the dataset showed which parcels the trees were on, but not the specfic location of each tree.

Ryan Ozawa (@hawaii) brought me (@rajhawaii) into the conversation suggesting I might have an app for TMKs. I didn't, but it got me thinking that I could build one pretty easily.

I started by exporting the dataset as a spreadsheet and then bringing it into ArcGIS for Desktop. I've been using this GIS (geographic information system) software for many years and it is great for exploring and editing map data, combining different map datasets, and doing spatial analysis. I knew that the City's mapping open data portal (http://cchnl.maps.arcgis.com) had TMK parcels as a map service. All I needed to do was to re-format the TMKs in the spreadsheet to match the format of the map service and then I would have a map of the parcels with exceptional trees.

Once I had the map dataset of parcels with exceptional trees, I turned to ArcGIS Online to move the data from my desktop to the City's mapping open data portal. I uploaded the dataset and published it out as a feature service. This feature service is now available for anyone to use for their own maps or mapping applications. Click here to learn more about this feature service.

Now that I had the feature service published, I needed to combine it with a basemap and define the symbology and configure the popup window to show attribute data. I again used ArcGIS Online, this time to create a web map.  I choose an imagery basemap, and since this is tree data, I symbolized the parcels with a green outline and an interior green color at 90% transparency. I configured the popup window to show the common name and species name of the trees as well as some locational information. This web map is now available for anyone to use for their own mapping applications. Click here to learn more about this web map.

Now that I had a web map, I could use it conjunction with one or more map application templates to create a web map application.  I started with a simple template that provides the user with a few simple tools to search for places, to change the basemap, and to share a map via email, Facebook or Twitter.

May 1, 2013 10:57 pm: Almost exactly 36 hours after Burt's initial tweet, I was able to tweet the link to my completed web map application. Click here to see it.

I have since used the same web map to create a second application that provides the ability to search by tree name. Click here to see it.

And finally, I can embed my web map into any web page including my blog, so here it is... zoom in, zoom out, pan across to see other parts of the island. And be sure to click on a green parcel to get info on the trees!


A hui ho!

Thursday, December 6, 2012

A Map for Every Story: Honolulu Sewer Projects

Have you ever noticed the lists of various road work projects going on that are published in the papers and government websites?  Have you ever wished that instead of a list they would show you a map?

List of Sewer Projects
Well, the City and County of Honolulu has heard your wish and they've started working on it.  The Department of Planning and Permitting (DPP) and the Department of Environmental Services (ENV) are publishing a web map that shows where sewer projects are taking place.

Let's start with the list.  Here's the way that information on sewer projects has been presented to the public for years.

Nice to have a list, but wouldn't a map be even better?

And here it is, a web map of sewer projects that is now being published by the City and County of Honolulu.

Web Map of Sewer Projects
The areas where sewer work is being done are highlighted in red.  if you click on one of the red lines, you will see information on that sewer project.

In this example, I clicked on a project near Ala Moana and a popup window opens to show information about that specific project.

It's simple, it makes it easy to see where sewer projects are happening, it's available for the public, and it's free.  Here's the link if you want to try it out:

Link to web map "Sewer Projects Construction Map"

I commend the City and County of Honolulu DPP and ENV for setting an example of how web maps can be used to easily convey location-based information to the public.  Now for that list of water projects, road work projects, parade routes...

Thursday, November 1, 2012

A Map for Every Story: Hawaii 2012 General Election

Political sign waving in Hawaii has been a tradition for decades. However, it is illegal around early voting sites through Nov 3 and around all polling places on Election Day Nov 6. Hawaii Revised Statutes §11-132 provides the details, basically no campaigning is allowed within 200 feet of a polling place including parking and access. Here's the link if you want to read the details:  
Link to Electioneering and Campaigning Factsheet
Old Electioneering Map for DP 21-02


Until now, if you wanted to see a map, you had to know the precinct (or DP) number.  Then you could go to the State Office of Elections website and download the map.  The map was also posted at the polling place.  Here's an example, the old electioneering map for DP 21-02.


But these days, with satellite images, with smartphones that know where they are, with online web maps, there must be a better map we can use for this story.  Esri worked with the State Office of Elections and the State Office of Planning to create new electioneering maps.  Here's the new electioneering map for DP 21-02.


These are not just static maps.  These maps are published online and can be viewed by anyone for anywhere in the state.  Better yet, smartphone users can use their phone to see the electioneering map for their current location.  


There is a gallery of regional maps for desktop and tablet users:

Here's the link:
Link to Hawaii Electioneering Map Gallery for Desktop and Tablets

Smartphone users, here are the links to mobile maps for each county:

Honolulu Smartphone Electioneering Maps
Hawaii County Smartphone Electioneering Maps
Maui County Smartphone Maps
Kauai County Smartphone Electioneering Maps

After you open the map on your phone, you can click the locate button (circled in red in this example) to move the map to your location.


ELECTION DAY UPDATE - NOV 6, 2012

After the polls closed on Election night, the electioneering gallery had been viewed 814 times. There were 1,173 views of the regional maps - 836 via desktop/tablet and 237 via smartphones.