Showing posts with label Maui. Show all posts

Wednesday, May 15, 2013

There's A Map For That: Online Mapping Resources for Hawaii

PCATT IT Summit
Presentation Notes
May 16, 2013
1:15 to 2:00 pm
Room 514

I love maps! And I love teaching teachers about maps and mapping software. So the PCATT IT Summit is a great chance for me to reach Hawaii high school Career and Technical Education (CTE) teachers and show them the great online mapping resources available here in Hawaii including data from the State of Hawaii and from our four Hawaii counties - Honolulu, Maui, Hawaii and Kauai.


Instead of handing out a piece of paper, I decided to blog my notes and relevant links so they're easy to find and share. So here we go...

These will only be some brief notes along with links to online resources. If you're interested, my full presentation is posted on slideshare. It's also embedded here:


GIS = ( ( Maps + Data ) * Analysis ) ^ ( Web + Mobile )

This handy formula summarizes the power of GIS, or geographic information systems. We start by looking at maps, but we more than just a map. We see things (features) on the map. And behind every feature on the map there is data describing that feature. On a paper map we can't see all that data, but when we bring that map on to a computer (using GIS), we can start asking questions and seeing patterns. We can start doing analysis. Analysis is the "force multiplier" of GIS. And in the last few years, all that power of GIS has been multiplied exponentially via the web and, even more recently, via mobile devices.

There was an article in the December 2011 issue of Honolulu Business Magazine that describes this in more detail and gives examples of how business and government use GIS. Here's the link:


There are many mapping applications now online, here are links to a few local ones you may find interesting:

Map Services to Web Maps

Behind the scenes, the mapping applications above are all using map services to create the maps and reports you see online. You can use these same map services to create your own online maps called web maps.  Here are some links to map services, web maps and web map applications:


Software, Training and more...

Fortunately for Hawaii teachers, the Hawaii Department of Education has a site license for the GIS software used for both desktop (ArcGIS for Desktop) and online (ArcGIS Online) mapping software that teachers can use for free!  The licenses are administered for DOE by the MEDB Women in Technology (WIT) Program.  Here are some useful links:


Tuesday, May 14, 2013

Esri Maui User Group Meeting Notes - May 13, 2013

banner
Yesterday I was in Wailuku for the Esri Maui User Group meeting.  Bill Medeiros, the user group coordinator, had asked me to go over tables, table relates and editing in ArcGIS for Desktop 10.1, and go over some of the new things in ArcGIS for Online.  My presentation on tables and table relates generated a lot discussion about parcel information and data maintained by the County of Maui Real Property Division, so much discussion in fact, that we ran out of time to cover all the topics.  So, I thought I'd use my blog to post notes on what we covered and what we didn't have time to cover.

TABLES AND TABLE RELATES

Maps are great, but what really makes our GIS (Geographic Information System) maps powerful is the data behind the map.  Every feature on the map has data (attributes) that describe that feature.  This data is stored in a geographic table with columns for the location/attributes and with a row for every feature.  The power of the GIS is expanded even more when we relate a geographic table to other non-geographic tables.  For example, a geographic table of tax map properties (parcels) might be related to a non-geographic table that lists the owner or owners of each parcel.

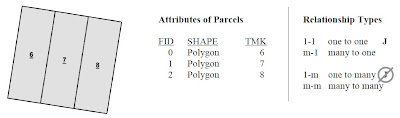
relate types
There are four main ways that tables can be related.  I won't get into the details here in my blog, but it is important that GIS users apply the correct type of relate between tables (safe relationships).  Click here for a link to a handout with some illustrations.

EDITING USING TEMPLATES

editing
Editing templates provide a very efficient way to add new features and data to your maps.  You can use templates based on symbology from your table of contents and set default data values for different types of features.  Our earlier discussion of parcel data at the meeting had taken so long that I didn't have much time to spend showing editing, but I did give a link to a great session from the 2012 Esri International User Conference where Jack Horton and Colin Childs give a very thorough demonstration of using editing templates.  Click here for a link to the 77 minute video.

LOCAL GOVERNMENT MAPS AND APPS

For my editing example, I used a public safety data schema from the Local Government Information Model, or LGIM.  Esri has developed this model based on its experience working with many state and local government agencies.  Agencies who adopted the LGIM can then use free maps and map applications (apps) to quickly create new, powerful mapping applications to server their local businesses and residents.  At the user group meeting I showed a few of these maps and apps.

Click here to see maps and apps for Land Records.
Click here to see maps and apps for Public Safety.
Click here to see maps and apps for Water Utilities.
Click here for more information on Local Government Maps and Apps.

And for those you who are developers, the code is available on GitHub.

SHARING USING MAP SERVICES

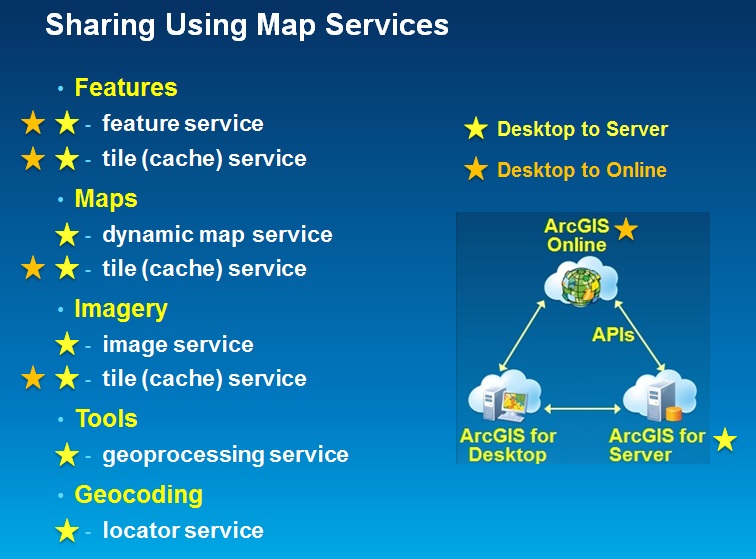
When GIS professionals share data they often use packages which work well for sharing with other GIS professionals, but require special software to use.  Now we can share data using map services which can then be used in a variety of ways by both GIS professionals and those without GIS experience.  During the user group meeting I briefly talked about the different types of services that you can publish from ArcGIS for Desktop 10.1 to either ArcGIS for Server or to ArcGIS Online.

In this diagram you can see which types of services you can use to share different types of data and tools.  All eight types can be published to ArcGIS for Server.  Four of the eight can be published to ArcGIS Online.  During the meeting I published my event planning data as a feature service to ArcGIS Online.  There are other types of services you can publish, click here for a complete list.

WHAT'S NEW IN ARCGIS ONLINE

The best way to keep up with what's new in ArcGIS Online is via the blogs.  Here are a few links you'll find helpful:

What's New - The Latest
What's New in March 2013
Bern Szukalski's Blog (my favorite)
All ArcGIS Online Blogs

Next Maui User Group meeting is August 26th.  Maybe I'll see you there!

Answers to Safe Relationships handout:
1)  1-1 (one to one)
2)  F (Fee)
3)  m-1 (many to one)
4)  Join Tenure to Parcels using TMK, then Join "Tenure Type" to Parcels using Tenure/Tentype
5)  1-m (one to many)
6)  You can, but don't!  Use Relate instead.
7)  Parcel 7, $200,000
8)  Parcel 6, $300,000
9)  Summarize Buildings table by TMK and Sum BLDGVAL, then Join the summary output table to Parcels using TMK
10)  m-m (many to many)
11)  Summarize Owners table by TMK and First OWNER, for all rows in summary output table where Count=1 you know the owner, for all rows where Count>1, set the owner name to "multiple" or something to indicate more than one owner.  You might even include the count itself, eg: if Count=7, set owner name to "multiple (7)".

Thursday, November 1, 2012

A Map for Every Story: Hawaii 2012 General Election

Political sign waving in Hawaii has been a tradition for decades. However, it is illegal around early voting sites through Nov 3 and around all polling places on Election Day Nov 6. Hawaii Revised Statutes §11-132 provides the details, basically no campaigning is allowed within 200 feet of a polling place including parking and access. Here's the link if you want to read the details:  
Link to Electioneering and Campaigning Factsheet
Old Electioneering Map for DP 21-02


Until now, if you wanted to see a map, you had to know the precinct (or DP) number.  Then you could go to the State Office of Elections website and download the map.  The map was also posted at the polling place.  Here's an example, the old electioneering map for DP 21-02.


But these days, with satellite images, with smartphones that know where they are, with online web maps, there must be a better map we can use for this story.  Esri worked with the State Office of Elections and the State Office of Planning to create new electioneering maps.  Here's the new electioneering map for DP 21-02.


These are not just static maps.  These maps are published online and can be viewed by anyone for anywhere in the state.  Better yet, smartphone users can use their phone to see the electioneering map for their current location.  


There is a gallery of regional maps for desktop and tablet users:

Here's the link:
Link to Hawaii Electioneering Map Gallery for Desktop and Tablets

Smartphone users, here are the links to mobile maps for each county:

Honolulu Smartphone Electioneering Maps
Hawaii County Smartphone Electioneering Maps
Maui County Smartphone Maps
Kauai County Smartphone Electioneering Maps

After you open the map on your phone, you can click the locate button (circled in red in this example) to move the map to your location.


ELECTION DAY UPDATE - NOV 6, 2012

After the polls closed on Election night, the electioneering gallery had been viewed 814 times. There were 1,173 views of the regional maps - 836 via desktop/tablet and 237 via smartphones.