Monday, December 10, 2012

A Map for Every Story: Spreadsheets to Maps

I've blogged before about taking a list of locations and turning it into a map. Another great source of location-based information for maps is spreadsheets. Google has a set of tools, so does Esri, and many others.

But what is the earliest known example of an app to build a map from spreadsheet data? Here's my nomination.

I lived and worked in Nepal for five years. In 1979 my wife got a job teaching at Lincoln School so we moved from Mountain View, California to Kathmandu, Nepal. I had been writing software on an Apple II computer so naturally I took it with me to Nepal, little did I know that it would be one of the first computers in the entire country.
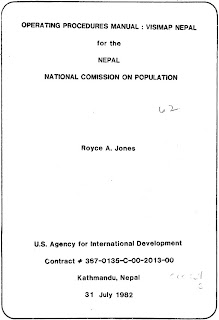
Visimap Nepal
I soon connected up with other geeks in Kathmandu and we created NAMASTE Apple (Nepal Association of Microcomputer Advocates for Support and Technical Exchange) and in a few years Apple II computers (we called them microcomputers at the time) were sprouting up all over the Kathmandu Valley.

I was hired by USAID (United States Agency for International Development) to support government ministries' use of computers. We set them up with Apple II computers with a CP/M card running Wordstar for word processing, dBase for database management and Visicalc for spreadsheets.

I had written a few mapping programs (in Fortran) as part of my undergraduate work in geology at Stanford, so when I saw government agencies entering national datasets into spreadsheets, I thought it would be a cool idea to try and map their data. The result was Visimap Nepal, a program that would take any national data in a Visicalc spreadsheet and turn it into a map.

Population Growth Rate from Visimap Nepal
The maps weren't very pretty, only black and white and low resolution, but Visimap Nepal was a hit. Here's an example of a map showing population growth rate data for Nepal.

You can easily see that the areas of high population growth were in the Terai region in the south, and the areas of low growth were in the Himalayas in the north. Similar maps were made of health data, agricultural data, forestry data, any data collected for the 75 districts in Nepal (a district in Nepal is like a state in the United States).

USAID has archived the "Operating Procedures Manual" for Visimap Nepal, here's the link:

Link to Visimap Nepal manual

So that's my nomination for the earliest app to build maps from spreadsheet data. It's been 30 years! Technology has changed a lot, but the value of seeing your data on a map is strong as ever.

Thursday, December 6, 2012

A Map for Every Story: Honolulu Sewer Projects

Have you ever noticed the lists of various road work projects going on that are published in the papers and government websites?  Have you ever wished that instead of a list they would show you a map?

List of Sewer Projects
Well, the City and County of Honolulu has heard your wish and they've started working on it.  The Department of Planning and Permitting (DPP) and the Department of Environmental Services (ENV) are publishing a web map that shows where sewer projects are taking place.

Let's start with the list.  Here's the way that information on sewer projects has been presented to the public for years.

Nice to have a list, but wouldn't a map be even better?

And here it is, a web map of sewer projects that is now being published by the City and County of Honolulu.

Web Map of Sewer Projects
The areas where sewer work is being done are highlighted in red.  if you click on one of the red lines, you will see information on that sewer project.

In this example, I clicked on a project near Ala Moana and a popup window opens to show information about that specific project.

It's simple, it makes it easy to see where sewer projects are happening, it's available for the public, and it's free.  Here's the link if you want to try it out:

Link to web map "Sewer Projects Construction Map"

I commend the City and County of Honolulu DPP and ENV for setting an example of how web maps can be used to easily convey location-based information to the public.  Now for that list of water projects, road work projects, parade routes...

Thursday, November 1, 2012

A Map for Every Story: Hawaii 2012 General Election

Political sign waving in Hawaii has been a tradition for decades. However, it is illegal around early voting sites through Nov 3 and around all polling places on Election Day Nov 6. Hawaii Revised Statutes §11-132 provides the details, basically no campaigning is allowed within 200 feet of a polling place including parking and access. Here's the link if you want to read the details:  
Link to Electioneering and Campaigning Factsheet
Old Electioneering Map for DP 21-02


Until now, if you wanted to see a map, you had to know the precinct (or DP) number.  Then you could go to the State Office of Elections website and download the map.  The map was also posted at the polling place.  Here's an example, the old electioneering map for DP 21-02.


But these days, with satellite images, with smartphones that know where they are, with online web maps, there must be a better map we can use for this story.  Esri worked with the State Office of Elections and the State Office of Planning to create new electioneering maps.  Here's the new electioneering map for DP 21-02.


These are not just static maps.  These maps are published online and can be viewed by anyone for anywhere in the state.  Better yet, smartphone users can use their phone to see the electioneering map for their current location.  


There is a gallery of regional maps for desktop and tablet users:

Here's the link:
Link to Hawaii Electioneering Map Gallery for Desktop and Tablets

Smartphone users, here are the links to mobile maps for each county:

Honolulu Smartphone Electioneering Maps
Hawaii County Smartphone Electioneering Maps
Maui County Smartphone Maps
Kauai County Smartphone Electioneering Maps

After you open the map on your phone, you can click the locate button (circled in red in this example) to move the map to your location.


ELECTION DAY UPDATE - NOV 6, 2012

After the polls closed on Election night, the electioneering gallery had been viewed 814 times. There were 1,173 views of the regional maps - 836 via desktop/tablet and 237 via smartphones.

Tuesday, October 30, 2012

A Map for Every Story: Oct. 27 2012 Tsunami in Hawaii

On October 27, 2012, a magnitude 7.7 earthquake off the west coast of Canada triggered a tsunami warning in Hawaii.  Residents and visitors in tsunami evacuation areas were warned to evacuate to higher ground.  For visitors in hotels, this usually meant moving to a higher floor.  For many residents it meant going to a family or friend's home outside the evacuation area.

HPD Facebook page
For those on Oahu needing a safe place to go, the City and County of Honolulu established 26 Tsunami Refuge Centers.  This information was shared with the public in list form.  The list looked like this on the HPD Facebook page:

Certainly a map can help with this story.  A map showing each of the refuge centers.  A map that could be opened on a desktop, tablet or smartphone.  A map that could show the refuge centers around a user's location. A map app that could be developed quickly.

It took me about one hour.  I used ArcGIS Online and created a web map combining map services from the City and County of Honolulu along with data points for the refuge centers.  I made several copies of this web map, each zoomed in on a different area on Oahu.  I then created an ArcGIS Online group and gallery for the web maps.

The gallery is still online.
You can view it at this link:

Oct 27, 2012 Oahu Tsunami Refuge Center Maps

I used Twitter to share links to the gallery and to each of the regional maps using the #hitsunami hashtag that was used during the event.  Interestingly, though maybe not surprisingly, the regional map links were re-tweeted more than the gallery link.

The first wave arrived at 10:28 pm (22:28) local time.  Fortunately for Hawaii, the tsunami was only 2.5 feet high and there were no immediate reports of damage.  While the evacuation was a necessary precaution given the uncertainty in predicting tsunami wave heights, in this case residents and visitors were soon able to resume their normal activities.

Tuesday, October 9, 2012

A Map for Every Story: Honolulu Council District VI Special Election

Will I be able to vote in the Honolulu Council District VI Special Election?

If you're blogging or writing an article on the Honolulu Council District VI Special Election 2012, here's a map for that story:


View Larger Map

You can embed this same map in your story using the HTML code in this file:
https://docs.google.com/open?id=0B79hRbgog1SbVmJWaHh0SDNrTUk